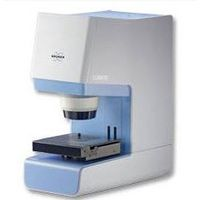
Bruker Corporation - LUMOS FTIR Microscope
No Documents
Fully Automated Stand-Alone FTIR Microscope
Evaluation and visualization of the microscopic data is performed in the powerful and intuitive OPUS Chemical Imaging software. Although the LUMOS is designed to be operated by non-experts for routine applications, its exceptional sensitivity makes it also very suitable for high demanding applications.
Active Questions & AnswersAsk a Question
There are no current Discussions
Need Equipment Support?
Documents & Manuals
There are no Documents or Manuals available.
Features of LUMOS FTIR Microscope
- Stand-alone FTIR microscope with full automation * Highly comfortable and easy in use * Motorized ATR crystal (ATR = Attenuated total reflection) * Fully automated measurement in transmission, reflection and ATR mode * Large working distance; allowing ample space for sampling * Outperforming quality in both IR and VIS range * Space saving footprint
General Specifications
| Depth | 520 mm |
| Height | 640 mm |
| Width | 300 mm |
| Peak Power | 90 W |
| Weight | 50 kg |
Additional Specifications
10 years
5 years)
10 years) and low power consumption.
IR detector: High sensitive photoconductive MCT detector; DTGS detector as option
A/D converter with true 24 bit dynamic range
Spectral range: 6000 – 650 cm-1
option: 7800 – 450 cm-1 with KBr-Optics and broad band MCT
Wavenumber accuracy: ? 0.05 cm-1 @ 1,576 cm-1
Optics: Sealed and desiccated; purge with dried air not required
Measurement of macroscopic For the investigation of larger samples a MACRO UNIT is available.
samples (option): It is connected on the left side of the LUMOS. Allows use of all ALPHA sampling
modules for transmission, ATR, diffuse and specular reflection. Electronic recognition
and automated OQ/PQ tests are implemented.
Software: < The LUMOS is controlled by the OPUS software.
The user interface guides the user step by step through the process of data
acquisition. At each step the user interface only provides the appropriate functions
to proceed.
Fully automated data aquisition in transmission, reflection and ATR.
Results are stored in a single file including visible images, spectral data and
information about the sample and the experiment.
Visualization of IR-images in 2D and 3D next to or on top of the visual images
Evaluation of IR-data by many different uni- and mulitvariate methods.
Identification via spectral search or multilinear regression.
Export of data with high resolution in several formats.
Calibration: Automated calibration of stage and optical system
cGMP/GLP/cGMP: compliant (OPUS-OVP required)
CFR 21p11: compliant (OPUS-Validation required)
Validation < Fully automated tests for operational (OQ) and performance qualification (PQ)
DQ/OQ/PQ (motorized sampling stage required)
European Pharmacopoeia < Software complies with GMP/GLP/cGMP
Japanese Pharmacopoeia < Software complies with regulation 21 CFRp11 (OPUS-VAL required)
Diagnostics < Qualification according to European (2.2.24) and Japanese Pharmacopoeia (2.25)
as option
Status light in software informs the user permanently about the current instrument
state and warns also if a test for OQ or PQ has expired